In our recent paper in current biology, we wanted a method we could use to automatically identify brief epochs of fictive turning in fly behavior. These 'fictive saccades' have been described throughout the literature; however there is no key feature that distinguishes a saccade from other epochs using the kinematic signals we collect during our experiments. Several algorithms exist to automatically identify these saccades. Ultimately though, evaluating the outcome of these algorithms is done in a subjective way. To make this final step of classifier assessment a bit more structured, I took advantage of the Bokeh plotting library to create a jupyter notebook-based gui to facilitate annotating our behavioral signals to create a ground-truth data set. We ultimately used this ground truth data set to tune the settings of our saccade detector using a recever-operator analysis.
%matplotlib inline
%config InlineBackend.figure_format = 'svg'
import pylab as plb
import numpy as np
import scipy as sp

plb.rcParams['pdf.fonttype'] = 42 #allows text in saved .pdf files to be edited in illustrator
plb.rcParams['image.interpolation'] = 'Nearest'
plb.rcParams['image.cmap'] = 'BrBG'
import h5py
demo_mode = False
This will download the 1.73G hdf5 file for our submission from the dryad repository.
!wget http://datadryad.org/bitstream/handle/10255/dryad.135499/trial_db.h5py?sequence=1
Our analysis is performed on the left-right wingstroke angles contained in the 'Ph2' dataset.
FlyDB = h5py.File('trial_db.h5py?sequence=1')
lmr_dset = FlyDB['Ph2']
saccade_analysis_data = h5py.File('saccade_analysis_data.hdf5','a')
This next block will initialize a new hdf5 file to store the annotated saccade data. we also pull out a random sample of 100 trials to use as our ground truth data.
# an index array for the trials that will be used to provide the ground truth data
ground_truth_idx = np.random.choice(np.shape(lmr_dset)[0],100,replace = False)
saccade_analysis_data.create_group('ground_truth')
ground_truth = saccade_analysis_data['ground_truth']
ground_truth['ground_truth_idx'] = ground_truth_idx
inspected = ground_truth.create_group('inspected_trials')
repnum = 0
This is the block that creates a gui. It uses the repnum variable to grab the sequence to annotate. If the sequence is annotated incorrectly it can be re-run to clear the output.
# modified from code found at https://github.com/bokeh/bokeh/issues/3776
trace_idx = ground_truth['ground_truth_idx'][repnum]
lmr = np.array(lmr_dset[trace_idx])
lmr[~np.isfinite(lmr)] = 0
xi = xi = np.linspace(0,23,1150) -10 #gd.get_xio('yaw_left')
import bokeh.models as bkmod #import CustomJS, ColumnDataSource, BoxSelectTool, PanTool,WheelZoomTool,Range1d, Rect
import bokeh.plotting as bkplot #import figure, output_notebook, show
from bokeh.core.properties import Enum

bkplot.output_notebook()

source = bkmod.ColumnDataSource(data=dict(x=[], y=[], width=[], height=[]))

callback = bkmod.CustomJS(args=dict(source=source), code="""
        // get data source from Callback args
        var data = source.get('data');

        /// get BoxSelectTool dimensions from cb_data parameter of Callback
        var geometry = cb_data['geometry'];

        /// calculate Rect attributes
        var width = geometry['x1'] - geometry['x0'];
        var height = geometry['y1'] - geometry['y0'];
        var x = geometry['x0'] + width/2;
        var y = geometry['y0'] + height/2;

        /// update data source with new Rect attributes
        data['x'].push(x);
        data['y'].push(y);
        data['width'].push(width);
        data['height'].push(height);

        // trigger update of data source
        source.trigger('change');

        // Define a callback to capture errors on the Python side
        function callback(msg){
            console.log("Python callback returned unexpected message:", msg)
        }
        callbacks = {iopub: {output: callback}};

        // Generate a command to execute in Python
        var ranges = {x: data['x'],
                      w: data['width']}
        var range_str = JSON.stringify(ranges)
        var cmd = "%s(" + range_str + ")"

        // Execute the command on the Python kernel
        var kernel = IPython.notebook.kernel;
        kernel.execute(cmd, callbacks, {silent : false});
    """%'print_vals')

selections = list()
saccades = None

def print_vals(ranges):
    global selections
    selections = ranges

def log_saccads(h5py_group_object):
    global selections
    try:
        tgroup = h5py_group_object.create_group(str(trace_idx))
    except ValueError:
        del(h5py_group_object[str(trace_idx)])
        tgroup = h5py_group_object.create_group(str(trace_idx))
    saccades = [{'x0':x0-w/2.0,'x1':x0+w/2.0} for x0,w in zip(selections['x'],selections['w'])]
    saccades = [np.argwhere((s['x0'] < xi) & (s['x1'] > xi)) for s in saccades]
    for i,saccade in enumerate(saccades):
        tgroup[str(i)] = saccade
    return saccades

box_select = bkmod.BoxSelectTool(callback=callback,dimensions = "width")
pan_tool = bkmod.PanTool(dimensions = 'width')
zoom_tool = bkmod.WheelZoomTool(dimensions = 'width')

TOOLS="resize,crosshair,pan,wheel_zoom,box_zoom,reset,box_select,lasso_select"

#p = bkplot.figure(plot_width=800,
#           plot_height=400,
#           tools=[box_select,pan_tool,zoom_tool],
#           title="Identify Saccades",
#           x_range=bkmod.Range1d(start=xi[0], end=xi[-1]/5.0),
#           y_range=bkmod.Range1d(start=np.min(lmr), end=np.max(lmr)))

p = bkplot.figure(plot_width=800,
           plot_height=400,
           tools=[box_select,pan_tool,zoom_tool],
           title="Identify Saccades",
           x_range=bkmod.Range1d(start=xi[0], end=xi[-1]/5.0),
           y_range=bkmod.Range1d(start=-4.0, end=4.0))

rect = bkmod.Rect(x='x',
            y='y',
            width='width',
            height='height',
            fill_alpha=0.3,
            fill_color='#009933')

p.add_glyph(source, rect, selection_glyph=rect, nonselection_glyph=rect)

p.line(xi,lmr)
bkplot.show(p)
The output should look something like this:
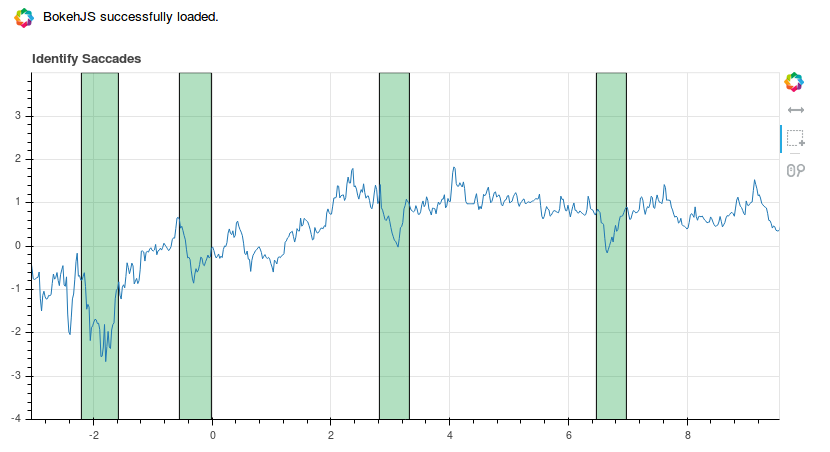
The green epochs I have annotated using the box select tool (the one with the dotted line and the little plus symbol).
Once a sequence is annotated it can be logged by calling the log_saccades function and then repnum is incremented to move on to the next trace.
log = log_saccads(inspected)
repnum += 1
logging should create a new nested dataset, a group keyed by the index of the trial and then a new dataset for each annotated epoch. This dataset should contain an array with the indicies of the epoch.
inspected.keys()
inspected['2230'].keys()
np.array(inspected['2230']['1'])
Comments
comments powered by Disqus